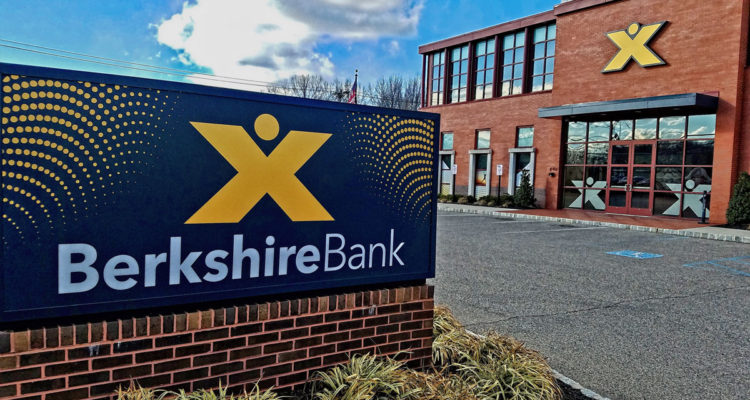
Berkshire Bank on Route 33 in Hamilton Square, NJ. Berskshire Hills Bancorp, Inc. is the parent company of Berkshire Bank. Photo by Michael A. Sabo
BOSTON, July 18, 2018, /PRNewswire/ — Berkshire Hills Bancorp, Inc. (NYSE: BHLB) reported second-quarter 2018 net income of $34 million, which was a 73% increase over 2017 second-quarter net income of $20 million. This primarily reflected the benefit of Berkshire’s Greater Boston expansion through acquisition and business development, resulting in higher market share, increased efficiency, and record profitability.
SECOND QUARTER FINANCIAL HIGHLIGHTS (income statement comparisons are year over year and balance sheet growth is compared to prior quarter-end):
- $0.74 EPS
- 9% annualized commercial loan growth
- 7% annualized deposit growth
- 18% increase in net revenue
- 19% increase in loan and deposit fee income
- 3.50% net interest margin
- 56.4% efficiency ratio
- 1.17% ROA
- 0.21% net loan charge-offs/average loans
- 0.20% non-performing assets/assets
CEO Michael Daly stated, “We achieved record quarterly return on assets, with income increasing by 35% over the prior quarter. Commercial loans grew strongly and our new Boston corporate headquarters teams are receiving good response to our expanded presence in Greater Boston. Our revenue growth and disciplined expense management produced record quarterly earnings per share, positive operating leverage, and improved returns on equity.”
Mr. Daly continued, “The integration of acquired operations was completed within plan in the second quarter and several company-wide initiatives have been accelerated to support the expansion of our deposit product set and delivery channels. Our annual Xtraordinary Day of Service in June tackled 74 community projects across our markets, totaling nearly 7,000 volunteer hours and 92% of our workforce. Our Foundation announced the appointment of a Corporate Social Responsibility (CSR) Officer to expand our multiple community engagement activities and implement an all-encompassing CSR strategy. Our strengthened financial condition was recognized with an A- bank deposit rating assigned by the KBRA Bond Rating Agency. Berkshire’s stock was added to the S&P 600 SmallCapR index during the quarter; this index tracks U.S. small cap companies and is included in the S&P Composite 1500R index, facilitating an expanded market for our stock.”
DIVIDENDS DECLARED
The Board of Directors declared a quarterly cash dividend of $0.22 per common share to shareholders of record at the close of business on August 9, 2018, payable on August 23, 2018. The dividend equates to a 2.2% annualized yield based on the $39.47 average closing price of Berkshire Hills Bancorp common stock during the second quarter. The Board also declared a quarterly cash dividend of $0.44 per share of preferred stock, with the same record and payment dates as above. The quarterly common and preferred dividends were increased by 5% in the first quarter of the year.
FINANCIAL CONDITION
Total assets measured $11.9 billion at midyear 2018. Second quarter loan growth included a 9% annualized increase in commercial loans, with increased originations in Greater Boston, as well as asset based lending growth across the franchise. Residential mortgage growth included the impact of seasonally higher mortgage originations. The 7% annualized increase in total deposits included higher growth of transaction accounts. Asset quality, liquidity, and capital metrics remained strong at midyear. Non-performing assets decreased compared to the prior quarter and to the second quarter of 2017. During the quarter, book value per share increased to $32.49 and tangible book value per common share increased to $20.27.
RESULTS OF OPERATIONS
Revenue and expense in 2018 include Commerce Bancshares Corp. operations acquired in the fourth quarter of 2017. Most categories of revenue and expense increased due to this acquisition. Berkshire has completed the integration of these operations and by midyear 2018 had accomplished its objectives for merger-related efficiencies, which included cost saves originally targeted at 20%, or approximately $8 million per year.
Second quarter EPS increased by 40% year-over-year and by 35% quarter-over-quarter, including the impact of shares issued for the Commerce acquisition. There were negligible net non-core items during the most recent quarter, and both GAAP EPS and the non-GAAP core EPS measure totaled $0.74. Both of these measures were record quarterly results. Core EPS increased by 28% year-over-year and by 14% quarter-over-quarter. This improvement included the EPS accretion from the Company’s investment in expanded operations, including the Commerce acquisition.
Second quarter revenue increased by 18% year-over-year and by 5% compared to the prior quarter. This revenue growth contributed to an improvement in the efficiency ratio to 56.4%. The return on assets increased to a record 1.17%. The return on equity improved to 8.9% and the non-GAAP measure of core return on tangible common equity improved to 14.8%. This is a measure of the Company’s internal generation of capital to support growth and dividends.
The net interest margin improved to 3.50% in the most recent quarter, from 3.36% in the prior quarter. The contribution from purchased loan accretion improved to 0.25% from 0.13% due to a higher level of recoveries related to purchased credit-impaired loans. Asset yields and funding costs both increased including the impact of higher short term interest rates. Loan and deposit fees increased by 5% over the prior quarter. Mortgage banking revenue was unchanged, as a seasonal volume increase was offset by narrower margins due to industry conditions. The loan loss provision increased, exceeding net loan charge-offs, and adding to the loan loss allowance in line with loan growth.
Second quarter non-interest expense decreased from the prior quarter due to lower merger-related charges. Excluding non-core items, non-interest expense was flat, contributing to positive operating leverage and benefiting from merger cost saves and operating expense disciplines. Total full-time equivalent staff measured 2,004 positions at midyear, compared to 1,992 positions at the start of the year. The second quarter effective income tax rate was 20% in 2018 compared to 29% in 2017, reflecting the benefit of federal income tax reform which became effective in 2018.
BACKGROUND
Berkshire Hills Bancorp is the parent of Berkshire Bank – America’s Most Exciting Bank®. The Company has approximately $11.9 billion in assets and 115 full service branches in Massachusetts, New York, Connecticut, Vermont, New Jersey, and Pennsylvania providing personal and business banking, insurance, and wealth management services. The Company also offers mortgages and specialized commercial lending services in targeted national markets.
FORWARD-LOOKING STATEMENTS
This document contains forward-looking statements as defined in the Private Securities Litigation Reform Act of 1995. There are several factors that could cause actual results to differ significantly from expectations described in the forward-looking statements. For a discussion of such factors, please see Berkshire’s most recent reports on Forms 10-K and 10-Q filed with the Securities and Exchange Commission and available on the SEC’s website at www.sec.gov. Berkshire does not undertake any obligation to update forward-looking statements.
NON-GAAP FINANCIAL MEASURES
This document contains certain non-GAAP financial measures in addition to results presented in accordance with Generally Accepted Accounting Principles (“GAAP”). These non-GAAP measures provide supplemental perspectives on operating results, performance trends, and financial condition. They are not a substitute for GAAP measures; they should be read and used in conjunction with the Company’s GAAP financial information. A reconciliation of non-GAAP financial measures to GAAP measures is included on pages F-9 and F-10 in the accompanying financial tables. In all cases, it should be understood that non-GAAP per share measures do not depict amounts that accrue directly to the benefit of shareholders.
The Company utilizes the non-GAAP measure of core earnings in evaluating operating trends, including components for core revenue and expense. These measures exclude items which the Company does not view as related to its normalized operations. These items primarily include securities gains/losses, merger costs, and restructuring costs. Securities gains/losses include unrealized gains/losses on equity securities beginning in the first quarter of 2018. Charges related to merger and acquisition activity consist primarily of severance/benefit related expenses, contract termination costs, systems conversion costs, variable compensation expenses, and professional fees. These charges in 2017 and 2018 are primarily related to the business combinations with First Choice Bank and Commerce Bancshares Corp. Restructuring costs generally consist of costs and losses associated with the disposition of assets and liabilities and lease terminations, including costs related to branch sales. Additionally, the Company recorded charges for hedge terminations in the first quarter of 2017 and legal settlement costs during the year.
Non-core adjustments are presented net of an adjustment for income tax expense. This adjustment is determined as the difference between the GAAP tax rate and the effective tax rate applicable to core income. The efficiency ratio is adjusted for non-core revenue and expense items and for tax preference items. The Company also calculates measures related to tangible equity, which adjust equity (and assets where applicable) to exclude intangible assets due to the importance of these measures to the investment community.


